Building the Future of Historical Maps: Historica.org’s Latest Milestone
A New Chapter for Historica.org: More Updates, More Progress
Greetings! I’m Nikita Balabanov, the technical lead at Historica.org. Today, I’m excited to share a turning point in the development of our project—a moment where we can reflect on our progress, answer some questions, and unveil the updates our team has been working on.
Historica.org exists to provide accurate, interactive historical maps, enabling historians, researchers, educators, and enthusiasts to explore how human societies evolved across time and space. With this update, we’re moving from a development-focused phase into a stage where real-time updates and user collaboration are possible.
Explore the historical maps here to see how human civilizations evolved over time here.
User Perspective
We’re building Historica.org not just as a technical project but as a resource for users:
- Historians can explore region-specific historical evolution.
- Educators can use maps to illustrate territorial changes over centuries.
- Enthusiasts and researchers can create custom maps, combining historical data with personal research.
More Frequent Updates
The first big change: from now on, we’ll be posting updates more frequently. After a period of focused development, we’ve reached a stage where we can maintain steady momentum. This means you can expect to hear from us more often, stay in the loop about our progress, and see how Historica.org is evolving in real time.
We’re thrilled about the road ahead and can’t wait to bring you along as we continue building, improving, and expanding our project. A detailed technical history is provided here.
Current Progress: From Data to Historical Maps
After several rounds of development and refinement, we are proud to announce the first of our major releases: full historical maps of states from the year 1 to 2000.
This milestone represents a major threshold for Historica.org. Over the past 12 months, our team has made tremendous progress in data gathering, map building, and algorithm development.
Key Features Implemented
AI-powered data gathering – enabling us to collect and process historical information at a scale rarely seen in similar projects.
Multiple rounds of development and refinement of our deterministic map-building algorithm, including:
Adjusting borders based on the geographical features of the land.
Smoothing and refining borders, including coastlines, with a complex improvement algorithm.
A unique algorithm for placing text labels both inside and across polygons.
Extensive optimization cycles led us to completely rebuild the map builder in pure C, enabling better performance.
Web-based UI for the Map Builder, currently in alpha testing, which will allow users to quickly create their own maps.
With our Map Builder we are working on a service for posting user’s maps.
Region-specific historical maps —we’ve tested a new approach on different datasets, proving that our methodology works. This prototype offers detailed historical maps for regions within states, a feature that no other historical map project has attempted.
Precision Achieved
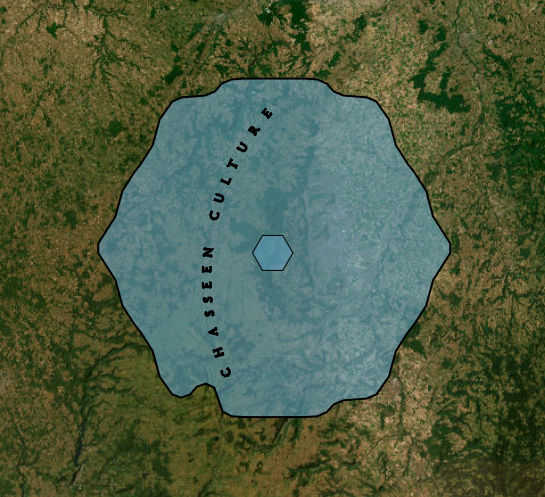
Our current maps offer a precision of 3 km.
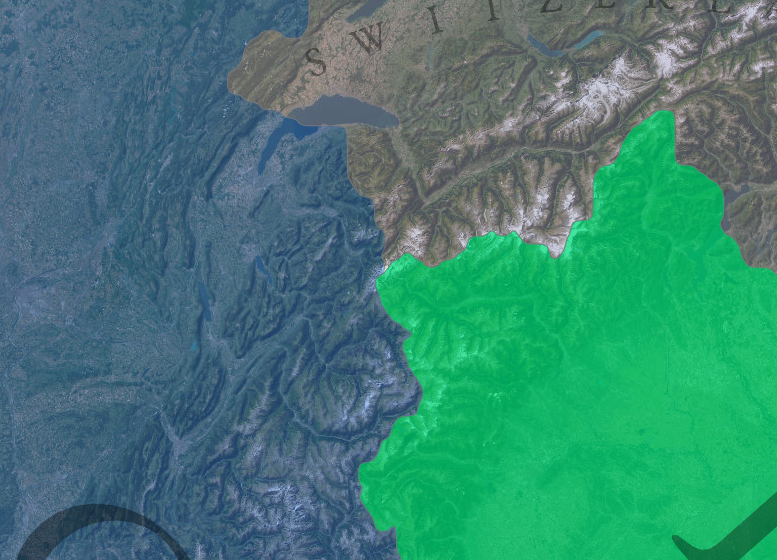
However, our system can produce maps with up to 10-meter accuracy. Here is the example:
Achieving this level of precision is computationally intensive, so it will be available exclusively in the custom map builder.
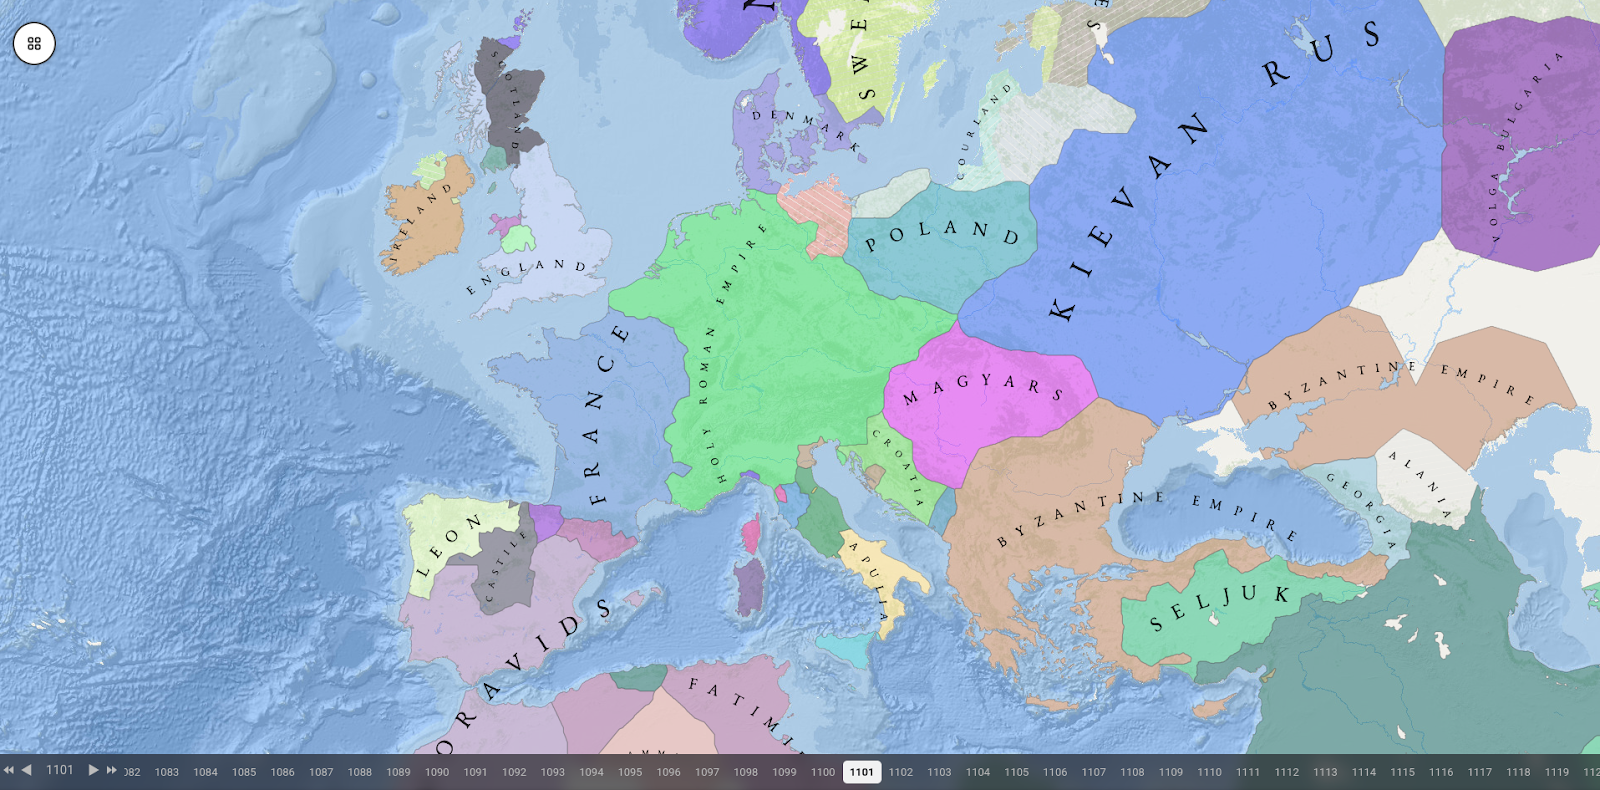
Map Update Preview
Please note that this is the first version of the map that we consider ready for release. It’s not complete yet, but it provides a solid starting point. We will continue to update the map iteratively, adding more details and improving accuracy over time.
Upcoming Features
A complete set of maps covering 4,000 years, from -4000 to -1.
After this update, our focus will shift to two major improvements:
- New map layers—we will create a full map covering the yearsyear 1 to 2025.
- Improved regional accuracy—updates will be delivered region by region. We’ll start with the Baltic and Scandinavia, gathering more historical data and points of interest before moving on to Eastern Europe and the Balkans.
- Additionally, we will continue to enhance and release the map builder for a smoother and more interactive experience.
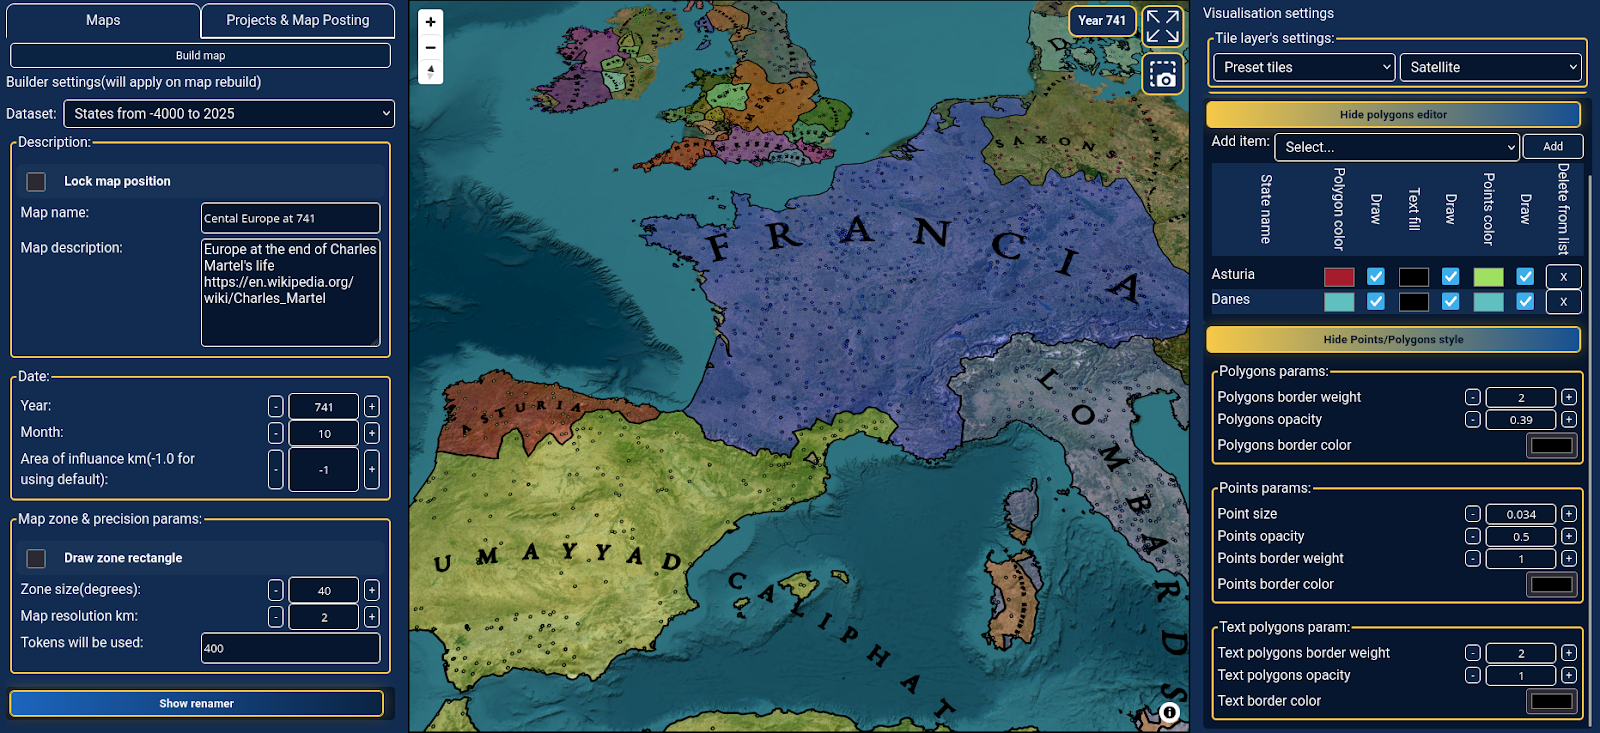
Map Builder Preview
We are excited to share more details about the upcoming alpha and beta tests of our map-building tools. These tools will allow users to create custom maps by combining our historical data with data extracted from their own sources. During a seminar at Cambridge University, we showcased a prototype of this map builder:
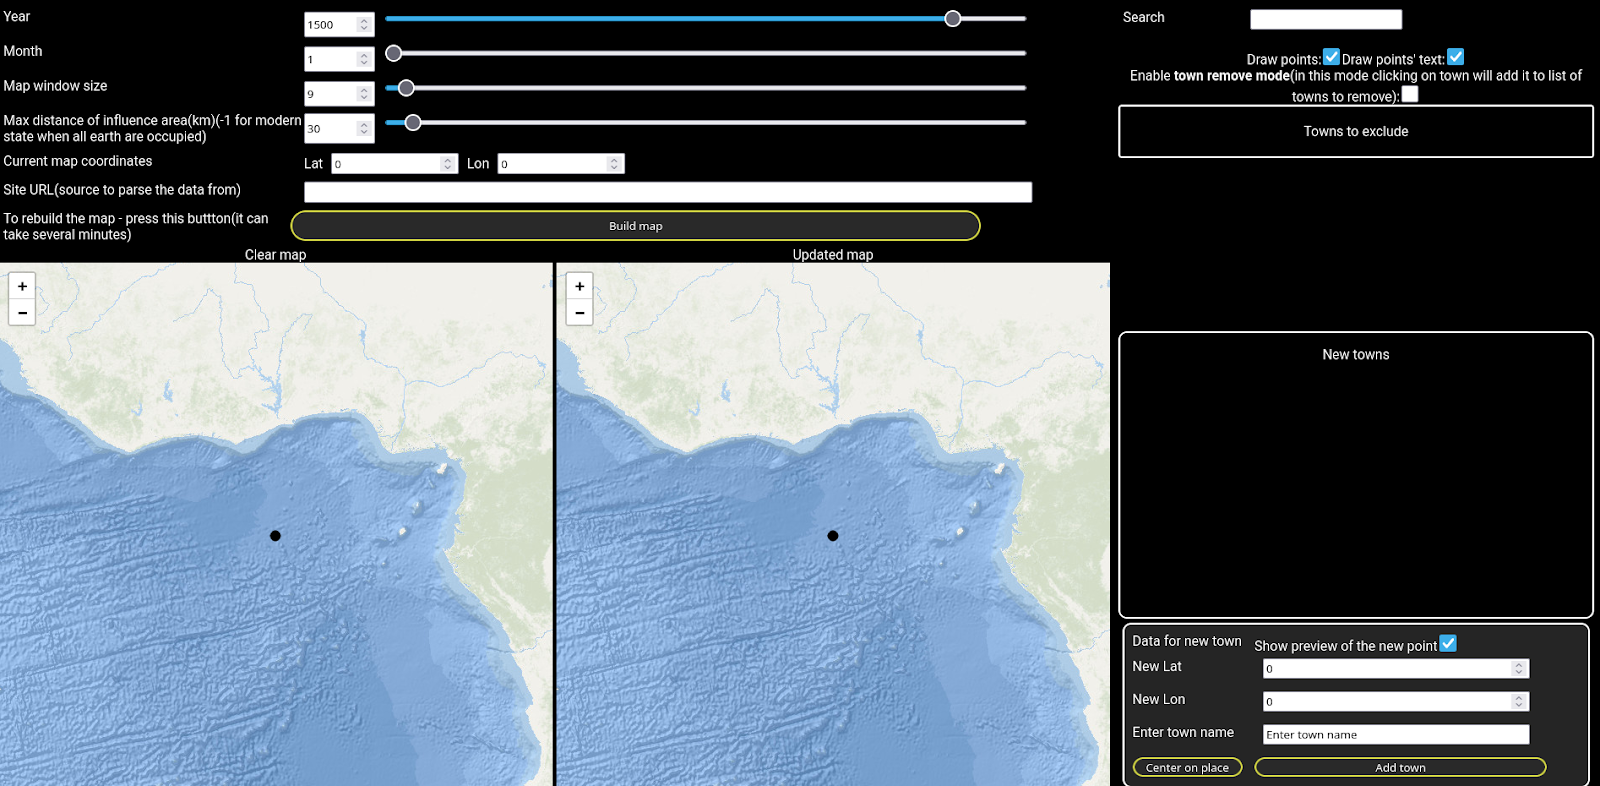
Now, we are glad to present an updated and refined version of this builder:
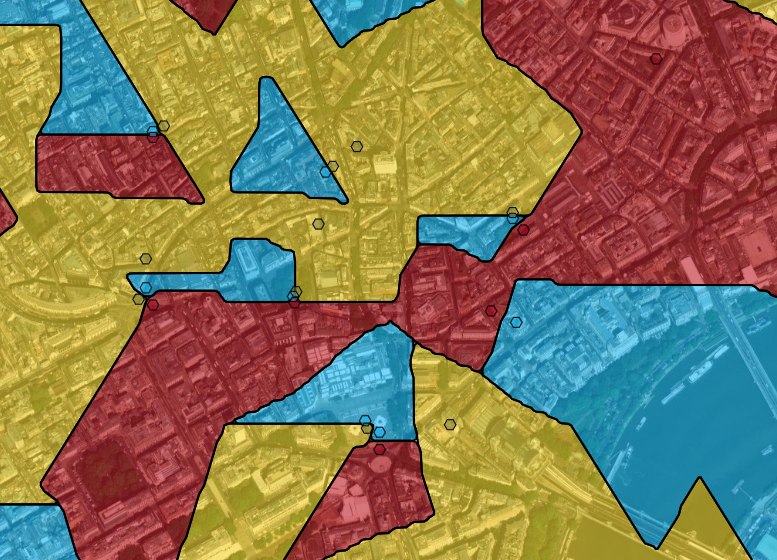
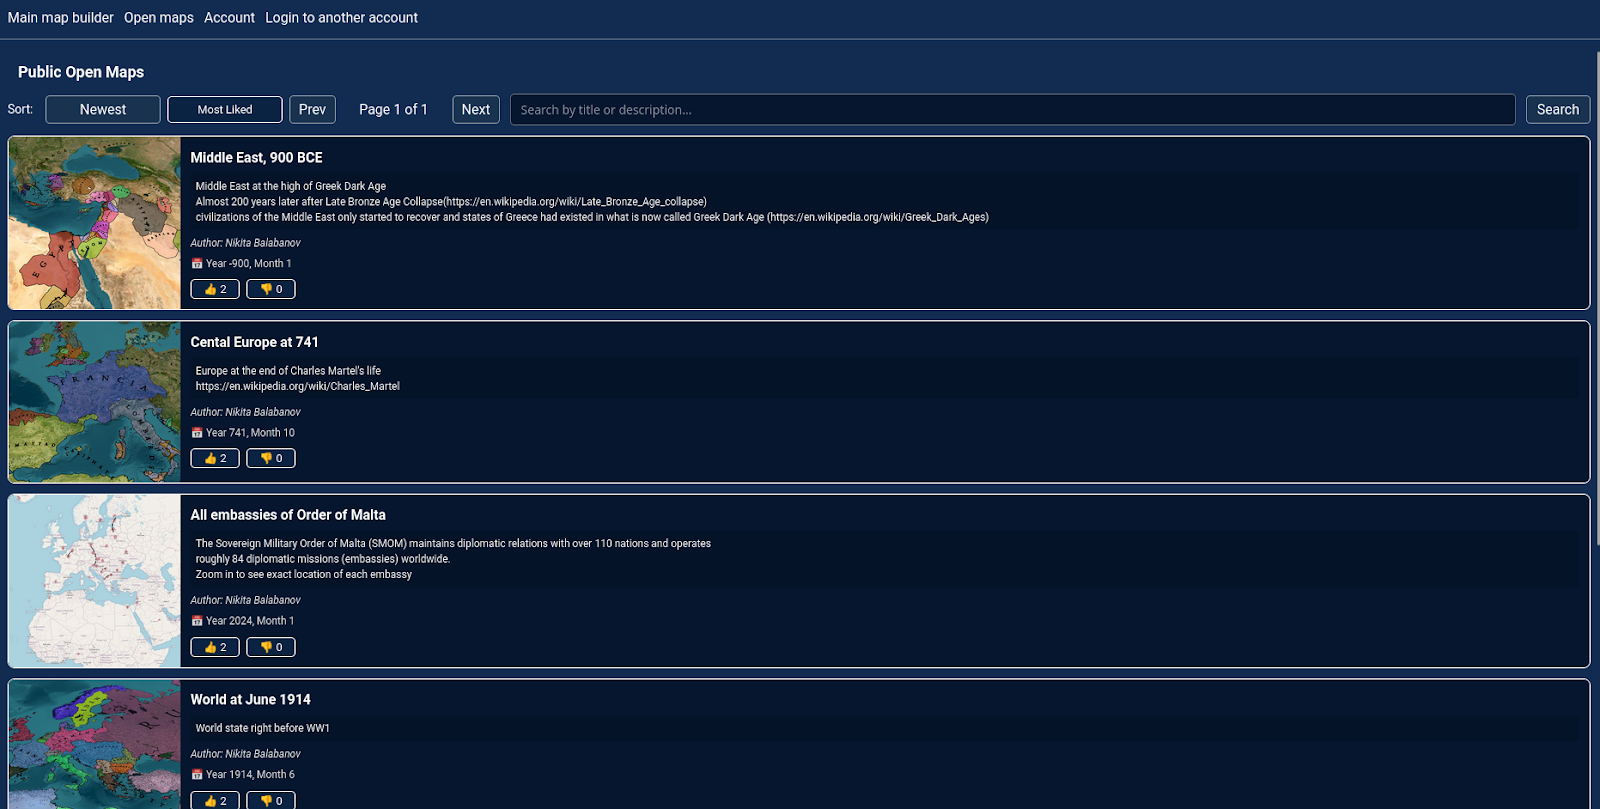
Here’s a preview of the UI for maps shared by users:
The Area of Influence Concept
One of the core concepts of our project is the Area of Influence.
Formally, it can be specified as: : if a state, culture, or entity X ruled over a place Y, this implies that X also controls some area around place Y.
Informally, it can be described like this: for most of human history, any settlement required a surrounding area to sustain itself.Over time, inhabited places often became control points for territories, even when agricultural space was no longer necessary.
From the earliest tribal communities to Sumerian city-states and all the way to the present day:
During our seminar at Cambridge University, we were asked how we determine the size of these areas of influence. At the beginning of the project, we used values that reflected the state-of-the-art values. The underlying logic is straightforward: over time, these areas naturally expand, often at an exponential rate. But the question remains: at what rate? How does the exponential growth of human populations relate to the amount of land effectively occupied by humanity?
The answer, at its core, is population:
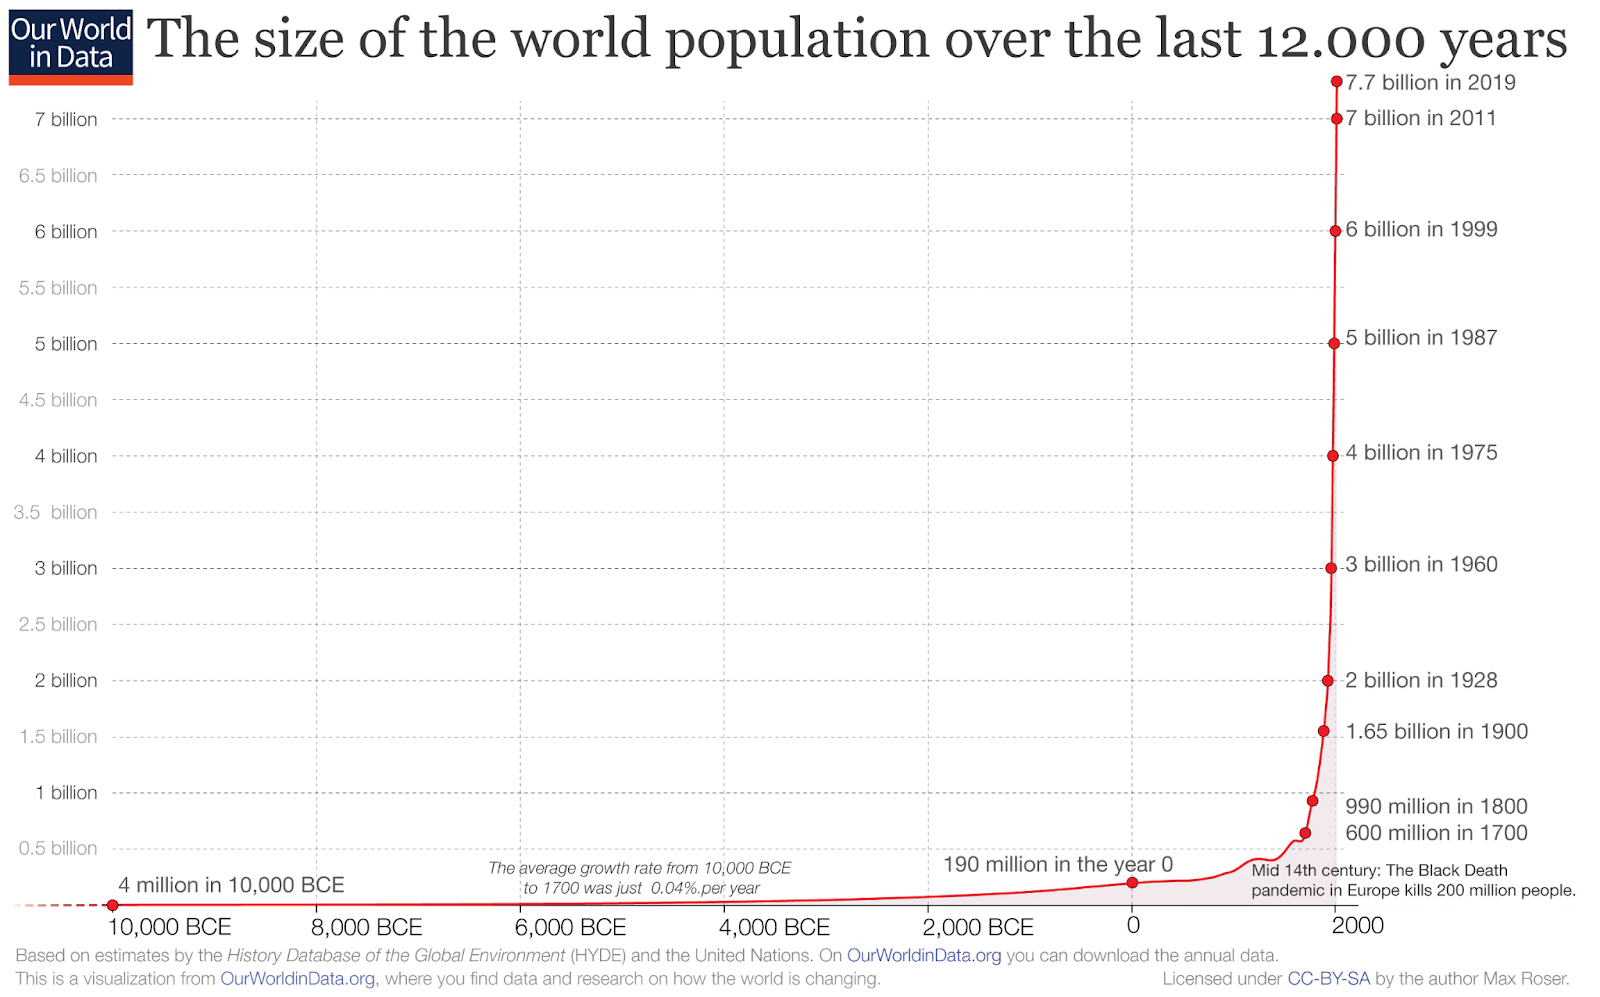
Of course, the minimum area of influence is relatively easy to define: a human can walk approximately 30 km per day, so we adopted this value as the minimum. The maximum area can theoretically be infinite, representing a scenario where humanity effectively occupies or claims all land on Earth (excluding Antarctica).
For values in between, we used a simple formula:
- current area of influence = current population / 1000000
- if current area of influence > 1000: current area of influence = inf
- if current area of influence < 30: current area of influence = 30
This approach produced very reasonable and consistent results.
Conclusion
Historica.org has reached an exciting stage: a working map system, precise historical data, and tools that will allow users to interact with and expand our maps.
Looking forward, we aim to:
- Expand coverage to 4,000 years of history.
- Improve regional accuracy and map interactivity.
- Continue testing the alpha and beta Map Builder, integrating user feedback to make Historica.org a collaborative platform for exploring human history.
We’re thrilled about the road ahead and can’t wait to bring you along as we continue building, improving, and expanding Historica.org. Stay tuned for the next update—and if you want early access to the Map Builder, send us an email at info@historica.org