

Technology
Historica is working to employ AI to process and manage vast amounts of data from various scientific fields. We are sharing our technological diary about our experience with using AI to create a digital map of human history.

March 2026. New Technological Updates in Historical Mapping
This update focuses on continued improvements to our mapping and historical data systems, with an emphasis on correcting geographic inaccuracies, better distinguishing political entities, and improving how large-scale historical datasets are processed and maintained.
We are also steadily advancing the underlying tools that support map generation and simulation stability, especially as the volume and complexity of our historical records continue to grow.
Historical Map Improvements
Recently, we released our first major update, and we are already preparing the next one, which will be coming soon. In this release, we addressed several key issues and implemented important fixes:
1. Gaps within polygons appearing in areas with significant mountain ranges or complex terrain within a state (for example, the Alps within the Roman Empire).
2. A better distinction between states and tribal or pre-state geopolitical entities was achieved by compiling a list of features for states and calculating the sums of these features:
- Centralized Authority
- Defined Territory
- System of Laws
- Administrative Structure
- Taxation / Resource Control
- Military Organization
- Social Stratification
3. First iteration of an automated historical record validation system. As our core dataset continues to expand significantly in both volume and temporal scope, it is no longer feasible to manually review and verify each individual historical entry. To address this issue, we are developing automated and semi-automated mechanisms to detect, filter, and correct inaccurate or inconsistent historical records.
Map Builder: Optimization and Stability Improvements
Our ongoing work on builder optimization and stability continues and will remain a long-term focus.
New Geo-Features Algorithm
We are continuing to develop new ways of incorporating geographic features into our maps. The latest improvement focuses on adjusting geographical distance multipliers to follow a more exponential model, better reflecting the tendency of historical human civilizations to develop in lowland regions (with known exceptions such as the Inca civilization).
This adjustment aims to produce more realistic state formation patterns, encouraging settlements and states to align more closely with rivers and coastlines.
Source diversification
We’re nearing completion of our base dataset—it has been collected, largely filtered, and cleaned. However, as discussed in our previous articles and during the Cambridge seminar, this dataset is only a framework.
The real value lies in what we build on top of it. With this groundwork in place, we’re now in a strong position to significantly enhance both the depth and quality of the data moving forward.
A key step forward is the ability to leverage contextual data, combining coordinates with time periods to streamline data collection. Models will not create so many variants of the same names—it has been and remains a major problem for historical records.
Next, we will start using a wider range of different models for additional data gathering. During the creation of the base dataset, we were limited to only two models—Herodotus and models from OpenAI.
This was necessary to ensure a more or less consistent naming convention. Now, we can incorporate other LLMs while maintaining the current context, so all new data will remain aligned with our established naming agreement.
We will begin by experimenting with Gemini models. Our goal is to improve map precision in the Baltic region by adding new points and collecting associated historical records.
Once we have tested and optimized the pipeline for these improvements, we will begin improving our maps zone by zone.
August 2025. New Technological Updates in Historical Mapping
This update highlights the latest technological improvements in rendering historical maps: prototyping conflict zone layers, advanced algorithms for precise state name placement, and an early system for parsing textual historical data into geospatial points.
These developments aim to enhance both the accuracy and clarity of our maps, especially in complex or contested regions.
Prototyping Conflict Zone Layers
Before developing comprehensive layers of wars, we began by prototyping a layer focused on conflict zones of the 20th and 21st centuries.
Unlike open wars, which typically involve active territorial changes, these zones often represent political conflicts without direct military confrontation—making the task considerably more complex.
We view this as a crucial part of our project, as it allows us to highlight areas on the map where the borders built by our system may hold contested political significance from different perspectives. Examples include the Kosovo political conflict and maritime disputes between Greece and Turkey.

State Name Rendering
Currently, we render state names on the map using HTML and CSS, which leads to several issues such as inconsistent fonts across devices, font scaling problems, and placement errors resulting in either overlapping labels or missing names.


Using advanced geometric techniques, we can now render text as independent polygons and position it within border polygons at various angles and positions, maximizing both size and readability.
Developing an efficient algorithm was certainly challenging. Speed is critical, as we need to process a vast number of polygons—for example, when analyzing the 20th century:
- 12 months × 100 years = 1,200 maps
- Each map contains ~5,000–6,000 polygons
While we do not place text on all of them, the number of labeled areas remains substantial. Nevertheless, this approach significantly enhances the clarity and readability of the maps.

Early Development of a Historical Data Parsing System
We are currently in the early stages of developing a system that will enable users to parse textual materials and add historical points to the map, facilitating the creation of more accurate and detailed local maps.
We have developed a pipeline for automatically parsing textual sources, for example, Wikipedia pages, and extracting historical data.
Wikipedia pages:
This allows us to place historical events and entities precisely on the map, improving the depth and detail of our visualizations.


June 2025. New Technological Milestones in Historical Mapping
This article highlights our latest breakthroughs in historical mapping and outlines our roadmap for developing a historical research tool.
Over the past several weeks, we’ve completed multiple iterations of Historica’s maps, each significantly improving in quality and functionality.
Discover the map here https://map.historica.org/
Highlights
- We've begun using more advanced techniques to define shorelines, enhancing the accuracy of both continental and island borders.
- We divided the data gathering process into segments of approximately 20 years each. Combined with a new data format, this approach has improved the consistency of state names across all points of interest.
- Using a new linear algorithm for polygon building instead of the Alpha Shape algorithm allowed us to speed up the building process considerably.
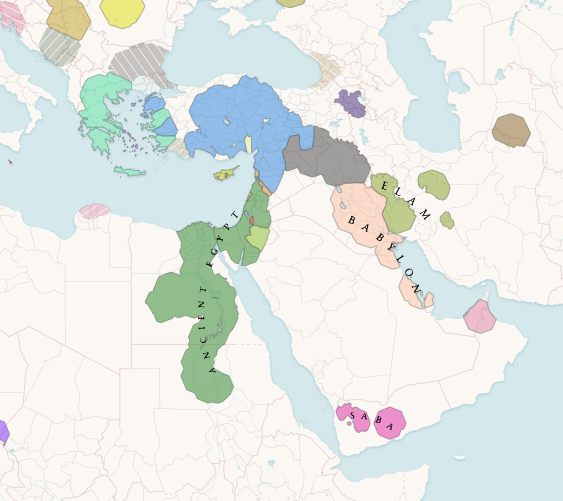
As a demonstration of our recent progress, we present a series of maps depicting January 1900, showcasing the improved precision and detail of our latest iterations.


On the left map, you can easily spot small fragments of one country appearing inside another. This issue was caused by an unstable data gathering algorithm and has since been resolved.
To appreciate how closely the country shapes on Historica’s map now match real-world maps, you can compare them side-by-side with an existing reference map:
For comparison, below is the map representing January 1, 1900—illustrating the level of detail and accuracy achieved in our current version.


Significant work remains to enhance map quality, particularly through the addition of more points of interest, such as towns and cities, and by extending the dataset to encompass a wider historical timeframe.
Our current plan is to gather data between the years 2024 and 1500 by months, adding new points and building maps for this period. The 20th century was a great playground for our research - primarily because of the sheer amount of different historical events that can be seen on the map and gave us many challenges.
Two World Wars, splitting of Germany into East and West, and the rise and fall of empires such as the Japanese Empire, Austro-Hungary, and the Soviet Union—these are just a few of the major events that took place over the last 124 years.
By overcoming the many challenges posed by these events, we are now confident that our project’s methods and algorithms can be applied to much earlier historical periods.
Historica Map Tool
Our next primary goal is to create a tool that allows users to dynamically add or remove historical points of interest and rebuild maps accordingly. This could be particularly useful for researchers who want to create maps specific to a certain time (or time period) and geographic zone.
A researcher focusing on a very specific historical event often possesses more detailed and precise knowledge about the area of interest than our system currently provides.
Therefore, we aim to offer a tool that enables users to correct inaccuracies or add new information, either manually or by uploading specially formatted data files. This concept is still in development, but we can already showcase a small example of how it will work.
Below is an example demonstrating how national borders can change by simply adding one point:
%2C%20Austria-Hungary(bottom)%20and%20Russia(top%20right).png)
April 2025. New Technological Milestones in Historical Mapping
We stepped out from the previous approach of generating historical maps using Image generation modes due to unreliable and hard-to-control results of models.
Our previous approach was based on a combination of state-of-the-art maps and historical points to generate ready maps(more precise versions of state-of-the-art maps). But due to different map formats in different sources, problems with verification of sources of these maps and complications with synchronization of historical names, it was decided to step aside from this approach and use part of this solution(historical points) as the basis for a new method.
After some research and counting of available resources and costs of data gathering, we figured out a new way to build historical maps:
Our new approach is based on pretty simple logic - human civilisations centered around some significant places for the most time. So what a real historian who builds a map of, for example, Kingdom of Mercia for a chosen year will do?
This historian will gather data about what places were mentioned as part of Kingdom of Mercia at the chosen year(+/- some years probably) and will place them on a map. Considering geographical details - like rivers, seas, mountains ranges and so on, - some parts of borders can be easily visible. Other parts of borders can be traced by mentions of places that were owned by different states around the chosen one. Most probably that border between two towns with different owners would be somewhere in between of them.
And after it, if the time and place consist of areas that weren't populated or recorded to be populated, real historians will choose an area around the known places that can be effectively ruled by the owner of this place at a given time. Maps of Sumerian states can be good examples of using such areas.
Our new approach is more determined, based on gathering data about historical places. After it we iterate over every year and extract data from our database to create a subset of points and its name + owner state name.
After some corrections of owners' state names, it's possible to create maps using our version of nearest neighbour clustering algorithm.
Data gathering
Our method of data gathering consists of several vital stages.
- Data basis creation, - creation of list of places with their low-dense history timeline using chatGPT.
- Verification of this basis.
- Use local deepseek and phi4 models to extract data from wikipedia pages and fill/verificate timelines of our places.
These stages can be repeated to increase precision of our data.
After our data will be ready, it would be possible to start to use different written sources for adding/verification/correction of our dataset.
Also we plan to create a system that can verify historical facts by our database.
Point clusterization and alpha shape
During map building the system fixes some states’ names errors and group semantically synonymous names together to create usable data.
Building of actual maps is impossible by standard clusterization algorithms due to specifics of our task.
Most suitable algorithm of Nearest Neighbour was adapted to our task and now consists of two different types of points and an optimized algorithm for points search and distance measurement.
Simple example is map of mesopotamia at the year -2000 can be used to see some insights in our system:

On the example below base points can be seen(this points will not be on actual map of course):

Another example is map expansion that have to be done for more modern maps:
Map of part of USA and Canada(owned by British Empire at the time) at the year 1900:

This holes has to be filled on the maps of modern states(after the year ~1800), so we use fast iterative map expansion algorithm:

This is a filled map for the same year(1900). Border between the USA and Canada isn’t so straight, but this will change when more data will be collected.
Of course this approach has several problems that we dealt with:
- Model’s output can range in prescription: for example the city of Prague at several years can be labeled as part of: Holy Roman Empire, Bohemia and Kingdom of Bohemia. Technically all these responses are correct - Kingdom of Bohemia was widely known as Bohemia and was part of Holy Roman Empire. But for our goal - we need to label Prague as a part of the Holy Roman Empire, i.e. as part of a political entity of highest level of authority. So the responses have to be corrected through some steps of verification during map building, based on the year and semantic distance.
- Clusterization algorithm efficiency - planet Earth is a pretty big place, so it was necessary to optimize our custom algorithm of nearest neighbour clusterization and mapp expansion to make map building realistically fast.
- Colonial borders, sparse inhabited areas and nomad’s states. The place based system does not work so well with these three cases. Colonial borders were product of metropolys’ politic design and rarely relies upon real owners of places, so it's hard to recreate very straight lines of africans colonies for example. Syberia, Sahara Desert, Great Steppe, Greenland and the northern region of Scandinavia and North America together with Australia is another problem. How to determine the exact borders of the Mongol Empire in Syberia? How to map Touaregs territories in the Sahara? This issue can be solved by iterative map expansion.
- Times of turmoil. Times like WW1 and WW2, fall or Holy Roman Empire, Yugoslavia, Russian Empire or USSR, China yellow or red turban rebellion, Three kingdoms times or any of numerous big historical events is so convoluted that correct maps either cant be created at all, or be hardly readable anyway. We decided to choose different time deltas for data gathering based on different times: 10 years before year 1000BC, 5 year between 1000BC and 500BC, 1 year from 500BC to 1500 and 1 month after.
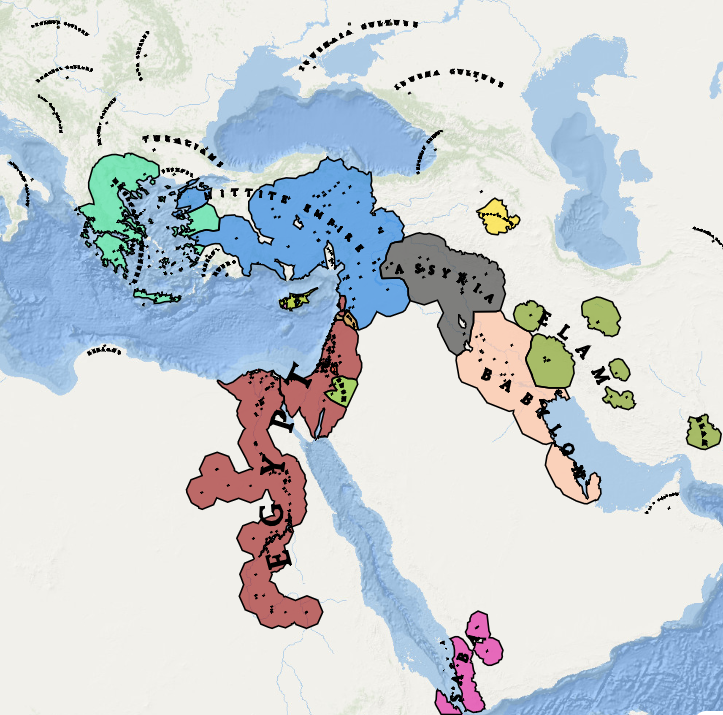
Example of current progress: World map for the year 1900.

We plan to show the first preview of the map in several weeks and improve it iteratively each 2 weeks. As we refine our approach and polishing map building algorithm and data, several next preview will be based on
This approach can be used to create maps of wars, religion, plagues, population density, languages and even archaeological cultures.
November 2024 — A Detailed Look at Our Latest Technological Advancements
After our previous research on bridging textual and spatial data, we have concentrated on fine-tuning our geospatial engine and optimizing our application to handle large-scale historical datasets. Below is an overview of the new improvements and experiments we’ve carried out since our last publication.
We aim to build an AI-driven system that can generate the borders of states and territorial formations. For modern borders, we possess near-comprehensive and highly accurate geolocation data often down to individual border markers. However, when it comes to territories that existed centuries ago, data is far sparser and less structured, typically compiled manually over many years. In our lab, we hypothesized that machine learning (ML) and deep learning (DL) techniques could help us predict these missing historical boundaries and then render them in an interactive mapping application.
As we first mentioned in our “October 2024” report, our goal is to develop a model that can produce state borders for various historical eras. Initially, we adopted an approach rooted in Support Vector Machines (SVM) to analyze modern borders in tandem with historical data and anticipate shifts over time. Yet, SVM alone did not yield the level of accuracy and scalability we desired. We therefore broadened our scope, exploring a wide variety of methods for creating historically accurate state and territorial boundaries.
All of our data flows through ETL pipelines in which we extensively utilize LLMs to facilitate data cleaning, transformation, and preliminary annotation. This pipeline underpins everything from text-based extraction of historical records to geospatial alignment and final map rendering.
Experiments with Boundary Generation Models
1. Classical ML Algorithms
1. Support Vector Machines (SVM)
- We used SVM to predict boundary changes by considering geopolitical conflicts, spatial characteristics, and historical context.
- While it provided initially promising results, its performance on large-scale datasets became a bottleneck, and it struggled to incorporate nuanced temporal relationships effectively.
2. K-Nearest Neighbors (KNN)
- Straightforward to implement and useful for quick prototyping.
- Poor scalability on massive datasets and a tendency to overlook historical patterns when faced with highly variable or incomplete data.
3. Random Forest
- Proved more accurate than SVM and KNN in capturing territory growth or shrinkage across different regions.
- Lacked a built-in mechanism for modeling temporal sequences, making it difficult to reflect gradual shifts or extended historical trends.
2. Deep Learning Approaches
1. LSTM (Long Short-Term Memory Networks)
- Particularly good at identifying long-range dependencies across decades or centuries, where boundary shifts occur gradually.
- Requires large, well-curated time series data and careful hyperparameter tuning.
- Promising for modeling the evolving nature of borders, although collecting enough high-quality chronological data remains challenging.
2. GAN (Generative Adversarial Networks)
- Capable of “generating” novel boundary lines that align with known historical patterns.
- Prone to hallucinations especially when source data is sparse or contradictory thus needing geographic rules (e.g., mountain ranges, rivers) or historically documented treaties to anchor outputs in reality.
- When combined with heuristic checks, GANs can generate surprisingly coherent historical boundaries.
3. CNN and U-Net with Attention Mechanisms
- Useful for segmenting scanned historical maps and extracting boundary contours.
- Require extensive labeled training data and a robust post-processing step to convert raw segmentation outputs into valid polygons.
- Attention blocks can help focus on crucial segments of the map, but the results often need additional geometric corrections to ensure historically plausible shapes.
3. Autoencoders
- Coordinate-Based Autoencoders
- We experimented with encoding and decoding polygon coordinates to reduce dimensionality and filter noise.
- Direct generation of boundaries from autoencoder outputs sometimes produced invalid or self-intersecting geometries.
- Autoencoders remain useful for data compression, but producing fully validated historical borders generally calls for additional algorithms that factor in geography and historical context.
4. Combining ML with Geographic Rules
- Hybrid Approaches
- We’ve found that blending DL-generated outputs with domain-specific heuristics yields the most promising results.
- For example, a GAN or U-Net might produce initial border candidates, which are then refined based on topographical features, documented historical treaties, or known cultural boundaries.
- This synthesis of machine learning and expert-encoded rules helps avoid “perfectly straight” lines where real historical frontiers would have followed rivers, mountain ranges, or shifting political influences.
Challenges and Future Outlook
1. Linguistic Complexity of Historical Names
We needed to unify our objects of study to address the variability of country and territorial names throughout different sources. A single state or region may be referred to under entirely different names from the standpoint of machine-driven semantic analysis. While we leveraged RapidFuzz and dictionaries, there are still instances where two distinct countries have very similar names. We plan to incorporate more sophisticated vectorization (e.g., TF-IDF plus context-aware semantics) for cross-verification. Even though this solution will not solve the entire naming challenge, we have decided to expand our “historical dictionary” that tracks shifting city and country names across different eras.
2. Accounting for Time Sequences
We continue experimenting with LSTM and GAN models for periods spanning centuries. It’s crucial that our model not only captures the “moments of change” but also the gradual transitions in borders.
3. Scalability
As data volumes grow, we’re developing caching strategies and automatic polygon-recovery methods to maintain high performance without manual fixes.
4. Academic Validation and Beta Test
We’re preparing a private beta release of our application, inviting historians, researchers, and anyone who can help verify data accuracy and interface usability.We also plan to develop a recommendation system that suggests events and maps based on user interests.
Fine-Tuning Geodata and “Filling the Gaps”
One of our biggest challenges has been properly displaying incomplete historical boundaries and handling data “gaps” whether caused by missing records or inaccurate historical outlines. Recently, we introduced an algorithm that helps remove empty spaces on our map layers while preserving continuous border logic. We remain focused on improving our system for generating historical boundaries to enhance the historical accuracy of our outcomes.
Clustered Event Visualization
We completely revamped how historical events are displayed on the map. Instead of thousands of points cluttering the interface, we now:
- Group nearby points: A dynamic clustering mechanism merges events into “buckets.”
- Bounding box filtering: Loads only the data within the current view, substantially improving clarity and speed.
- Adaptive zoom: Clusters merge or split depending on the zoom level, allowing for an optimal number of events to display whether you’re looking at a single city or an entire continent.
These changes provide a more user-friendly interface and a notable performance boost when exploring time periods packed with historical events.
Continued Application Optimization
Versioning of Historical Boundaries
Another key step is the introduction of boundary versioning:
- Switching between datasets: We can now maintain multiple “versions” of the same region or country for different timeframes and different sources.
- New UI: A simple menu allows users to toggle among available versions, simplifying comparisons between earlier or experimental datasets and new, processed data.
This versioning feature boosts transparency by letting historians and enthusiasts see exactly how our methods evolve and verify changes in real time.
Current Tasks and Plans
- Refining Linguistic Unification: We continue tuning thresholds and rules, especially for historical toponyms where multiple naming variations are common.
- Further Optimizations and UI Improvements: We aim to expand the system of interactive map layers, incorporating new data types (religion, economy, migration) in addition to political boundaries.
- Deepening the Temporal Model: We’re advancing LSTM and GAN work while exploring Transformer-like solutions (Temporal Transformers). If sufficient data is available, these can more flexibly predict changes.
- Extending Testing, Metrics, and Potential Historian Feedback Loop: We look to implement additional metrics, formalize feedback channels with domain experts, and iterate more rapidly.
Our roadmap aims at a fully optimized, user-friendly platform. The majority of our recent efforts target ensuring the application smoothly handles complex historical data while remaining fast and straightforward to use.
Join the Discussion
We hope these updates offer a glimpse of how our technology is evolving behind the scenes. As we continue refining the entire pipeline from data loading to boundary generation we invite historians, geographers, and anyone curious about history to share feedback and test out new features. Stay tuned for news on our next major release. Your input is invaluable, and together we can create an even richer, more engaging tool for historical cartography.
October 2024 — From Text to Territory: An AI-Powered Approach to Historical Mapping
Since our last publication, where we delved into the potential of Large Language Models (LLMs) for feature engineering and annotating historical data, the work at the Historica Laboratory has advanced into exciting new territories. We began exploring the possibility of utilizing LLMs not only for textual data but also for geospatial data, aiming to create a more comprehensive and interactive representation of historical changes through visualization. In this report, we present our current progress in these experiments and outline our future direction.
The intersection of LLMs and geodata opens up fascinating possibilities. By bridging textual and spatial information, we can offer a richer, multidimensional perspective on history. This integration could significantly enhance the way historical data is analyzed and understood, potentially revolutionizing historical studies by providing dynamic visual narratives.
Extending LLM Applications to Geospatial Data
Building upon our previous research, we questioned whether LLMs could be effectively employed in constructing historical ontologies and annotating data. We assume that if LLMs excel in these areas, they might also prove invaluable in working with geospatial data. Our goal is to implement an LLM-based ETL (Extract, Transform, Load) pipeline to extract information about historical events from texts and link this data with geographical coordinates. By doing so, we aim to create a rich database of historical-geographical data, enabling us to visualize changes on an interactive map and provide accurate historical context related to these events. This approach not only broadens data analysis capabilities but also offers a deeper understanding of border changes and events across different historical periods.
Automating the transformation of textual historical accounts into geospatial formats could dramatically reduce manual effort and minimize errors inherent in traditional data processing methods. However, challenges remain in ensuring the accuracy and reliability of the data extracted by LLMs, especially given the complexity and nuance of historical texts.
Experiments with LLM-Based ETL Pipeline for Geodata
We initiated experiments with an LLM-based ETL pipeline for geodata using OpenAI GPT-4o-mini. Our objective was to transform textual data into geospatial objects with historical context and then store them in our database. Our geographical database is built on AWS RDS PostgreSQL with the PostGIS extension, allowing efficient handling of geospatial objects and high performance in processing complex geographical queries.
We observed that textual data could be effectively transformed into geospatial objects via LLMs. However, we encountered several nuances:
- Model Hallucinations: Although rare, hallucinations still occur. Occasionally, we observed issues with dates; the model might add an extra zero or misinterpret vague dates, recording them as the year zero AD. Therefore, there is a need to develop a separate moderation system
- Parameter Limitations in JSON Responses: For more precise and complete data extraction using JSON format, it's better to limit the number of parameters due to the limited memory of LLMs. Our experiments showed that with fewer parameters specified in the instruction (e.g., 5 parameters), the model extracted more objects (over 10) compared to when more parameters were specified (7–10 parameters), resulting in fewer extracted objects (less than 5).
- Optimal Use of Context Window: It's advisable not to utilize the model's context window to its full capacity (the model has a context window of 128K tokens and supports up to 16K output tokens per request). Splitting large texts into chunks around 50% of the model's maximum context window improves the accuracy and completeness of the collected information.
These challenges highlight the need for further refinement of our pipeline and enhancement of methods for verifying and validating the generated data. We plan to integrate additional verification stages to minimize errors and improve the quality of data entering our database. The core of the pipeline involves using LLMs to extract key elements from texts, such as place names, timestamps, and event types, and converting them into a standardized format. We employed a combination of LLM queries and other approaches to achieve preliminary data structuring.
Addressing these issues is crucial for the robustness of our pipeline. Developing a moderation system to catch and correct hallucinations can significantly improve data reliability. Moreover, optimizing the instructions and context window usage can enhance the model's performance, leading to more accurate data extraction.
Experiments with Visual Data and LLM-Based ETL Pipeline
To further enhance our model, we experimented with the OpenAI Vision API for analyzing images of historical maps. Our aim was to supplement textual data with visual information—identifying countries, cities, and borders on historical maps. This approach intended to create a more complete representation of state borders and their changes over time.
The experiment revealed that the model does not always retain all data in memory when analyzing images of historical maps. Consequently, only about half of the information was correctly transformed into a structure suitable for database storage. We faced challenges related to the volume and complexity of the data. The model often missed important details, such as small towns or geographical markers, and struggled to accurately identify borders in complex regions.
We also used a combination of the Vision API and traditional computer vision methods for image preprocessing (e.g., edge detection and object classification). It turned out that while LLMs perform well in recognizing large objects like countries or major cities, they often overlook details, necessitating additional manual correction and data refinement. We are improving our current solution and exploring new research to apply the latest approaches, aiming to delegate as much work as possible to the model without human intervention, while maintaining data completeness and accuracy.
These findings suggest that relying solely on LLMs for visual data extraction may not suffice, especially for detailed historical maps. Integrating traditional computer vision techniques can help, but achieving full automation without sacrificing accuracy remains a challenge. We are optimistic that advancements in AI will soon help us to bridge this gap.
Leveraging Open Data for Database Enrichment
Recognizing the importance of building a high-quality and reliable database, we began utilizing various open data sources to enrich our geographical database. We developed a set of parsers for automatically retrieving data from open APIs and various web resources, allowing us to expand our collection of historical data. The collected data undergoes a transformation process to conform to our database structure. We use the LLM-based ETL pipeline for data annotation, standardization, and formatting.
One of the main challenges is ensuring data consistency, as different sources may provide information in varying formats. To address this issue, we developed algorithms for automatic data normalization and used LLMs to resolve conflicts between different versions of data. This data then undergoes validation and transformation stages for integration into our geographical database.Integrating open data sources is a promising strategy to enhance our database's richness and accuracy. However, ensuring consistency and resolving inconsistencies between sources require sophisticated normalization techniques and conflict resolution mechanisms. LLMs play a crucial role here, but continuous monitoring and refinement are essential.
Generating Political Borders of States
Our goal is to develop a model capable of generating state borders across different historical periods. We initially employed an approach based on Support Vector Machines (SVM) to analyze current borders in conjunction with historical data and predict their changes.
However, beyond SVM, we are also considering and testing other approaches to find the optimal solution for our task.
Approaches We Are Using and Considering:
- Support Vector Machines (SVM): This method allows us to classify and predict border changes based on features such as historical events, geographical markers, and timestamps. SVM performs well when high accuracy is required, but its performance may decline with large datasets and complex dependencies.
- K-Nearest Neighbors (KNN): We considered using KNN for predicting border changes. This method is based on finding the nearest neighbors and their characteristics for prediction. KNN is simple to implement but suffers from poor scalability with large data volumes and low accuracy in complex dependencies.
- Recurrent Neural Networks (LSTM): LSTM networks can be used to model the temporal dynamics of border changes. This approach allows us to consider the sequence of events and predict border changes based on time series data. LSTM can capture long-term dependencies, making it attractive for our task. However, training complexity and high data requirements may be limiting factors.
- Generative Adversarial Networks (GANs): We are exploring the use of GANs to generate new borders based on historical data. GANs consist of two neural networks—a generator and a discriminator—that operate in a competitive environment. The generator creates new borders, while the discriminator assesses their realism. GANs can potentially generate realistic borders but require large amounts of training data and may face stability issues during training.
- Geographical Rules and Heuristic Methods: Instead of relying solely on machine learning, we are also considering geographical rules and heuristics for adjusting generated borders. For example, accounting for natural boundaries like rivers and mountains, as well as historically established borders, helps make the model more realistic and closer to actual historical data.
Current Progress:
We are actively testing these approaches and their combinations to determine which method best suits modeling historical border changes. Model training is conducted with hyperparameter optimization and the use of regularization methods to prevent overfitting and enhance the models' generalization capabilities. Finding the optimal approach for modeling historical border changes is complex. Each method has its advantages and limitations. Combining machine learning with domain-specific knowledge (e.g., geographical rules) may lead us to the best results. Ongoing experimentation and validation against historical records are essential to refine our models.
Developing an Interactive Application
We are excited to announce that we have begun developing an interactive web application that brings together all the results of our experiments. We are working on an application that will allow users to explore historical data through an interactive map in a user-friendly interface. Our goal is to create a platform for academic historians and history enthusiasts alike, enabling them to study history in a new format. We aim to consolidate various historical data into a comprehensive historical tapestry, with artificial intelligence and its facets being the main drivers of our product.
The interactive map is the central element, displaying changes in state borders over time. Users can select time periods, explore different regions, and access information about key events. Our application will also feature elements that allow users to filter events by categories such as wars, revolutions, or cultural achievements, and trace how these events influenced territorial changes. Moreover, we plan to use AI not only for data analysis and processing but also to address user queries through specific components of our application, enabling users to gain a complete understanding of events and their significance.
The application is still under development, and we are actively working on integrating all components—the graph database and a Retrieval-Augmented Generation (RAG) system based on this data, the geodata database, and border generation models. We are also developing a recommendation system that will analyze user interactions with the application and offer personalized materials for exploration.
The development of this application represents a significant step toward making historical data accessible and engaging. By leveraging AI and interactive visualization, we can transform the way history is studied and appreciated. The potential for educational impact is immense, and we are enthusiastic about the possibilities this platform offers for both researchers and the general public.
Conclusion
Our journey into integrating LLMs and AI technologies with historical and geospatial data has been both challenging and rewarding. We have made significant strides in automating the extraction and transformation of historical texts into structured geospatial formats, despite encountering issues like model hallucinations and data complexity. Our experiments with visual data highlighted the limitations of current models but also pointed us toward promising avenues for improvement.
By leveraging open data sources and exploring various machine learning approaches for generating historical borders, we are building a robust foundation for our interactive application. This platform aims to revolutionize the study of history by providing an immersive, AI-driven experience that combines rich data visualization with personalized exploration.
Looking forward, we recognize that there is still much work to be done. Enhancing model accuracy, ensuring data consistency, and fully automating our pipelines without compromising data quality are ongoing challenges. However, we are optimistic that with continued research, experimentation, and the integration of the latest technological advancements, we can overcome these obstacles.
If you want to be the first one who will test our application, subscribe to our news! We also invite history enthusiasts to discuss your thoughts and enhance our product. Together, we can push the boundaries of how technology and history intersect, creating tools and platforms that enrich our understanding of the past.
July 2024 - Roman Chepenko - From Text to Ontology: Developing an ETL Pipeline and Graph Database for Historical Data with LLMs
In the realm of modern technology and artificial intelligence (AI), significant progress has been made in applying various models to data, particularly historical data. This article discusses our novel developments and how we utilize different LLM models to study historical data.
In a previous publication, we explored the potential of various LLMs for feature engineering of historical data. We selected a specific set of texts and transformed historical text into JSON objects with defined fields. The paper "The Semantics of History" by the University of Barcelona formulates an approach to annotating and storing data for analyzing textual data from different fields of study. More details can be found here: https://www.historica.org/technology#may-2024-roman-chepenko-using-large-language-models-for-feature-engineering-and-annotating-historical-data
At Historica Technology Lab, we developed an innovative ETL (Extract, Transform, Load) pipeline for loading data into an "Ontology." This data pipeline transforms historical texts into structured data suitable for database storage. As part of our research, we aimed to create a prototype of a "historical ontology," a knowledge repository of human history. This article describes our approach to creating this pipeline, the results achieved, and potential application areas.
Methodology
ETL Pipeline
Our ETL pipeline is designed to extract data from historical texts, transform it, and load it into a database. The ontology was built using Amazon Neptune to ensure efficient storage and access to these data. The pipeline consists of several stages:
- Data Extraction (Extract): This stage involves analyzing historical texts using a specialized large language model (LLM). The primary goal is to identify key entities and relationships such as geographical locations, dates, archaeological evidence, participants in specific events, etc.
- Data Transformation (Transform): The extracted data is formatted into a JSON structure that includes three main categories:
- UT (Unit of Topography): Describes events tied to specific places and times.
- US (Unit of Stratigraphy): Describes material evidence of past events.
- AC (Actors): Describes individuals or organizations associated with the events.
- Data Loading (Load): The transformed data is loaded into the Amazon Neptune database. A custom script creates vertices and edges in the graph database, linking entities and their attributes. The database architecture was designed based on the approach formulated by the authors from the University of Barcelona.
Justification for Choosing a Graph Database
The decision to use a graph database (in our case - Amazon Neptune) was driven by several key factors:
- Flexibility in Data Modeling: Graph databases like Amazon Neptune allow for modeling complex relationships between entities. This is crucial for historical data, where events, individuals, and artifacts can be connected in many different ways.
- Scalability: Amazon Neptune provides high scalability, allowing for efficient processing and storage of large data volumes. This is critical for historical research, where data volumes can be substantial.
- Query Performance: Graph databases offer high performance for complex queries, making them ideal for analytical tasks and uncovering hidden relationships in the data.
Ontology: Working with the Database

Our pipeline allowed us to populate our database with historical data according to the planned structure. After thorough testing and data quality checks, we developed our prototype "historical ontology."
For working with the database, we use an application based on a large language model (LLM) that enables text queries to the Neptune database. The application integrates with the OpenAI model to generate responses based on the data stored in the database. For implementing the LLM application, we used the langchain library and the RAG approach to LLM utilization.
Key Components of the Application
- Database Connection: The application establishes a connection to Amazon Neptune using a specialized driver for graph queries.
- Query Formation: Queries to the database are formed in natural language and passed through the LLM, which translates them into corresponding database queries. This allows users to interact with the database without knowing specialized query languages like Gremlin or Cypher.
- Result Processing: The query results are processed and presented to the user in an easy-to-read format, allowing them to obtain the necessary information without needing to interpret raw data.
Results
Our approach demonstrated high efficiency in working with historical data. For example, during testing, when querying the database for information using text queries, we were able to quickly retrieve answers to any questions contained in the database.

Discussion
Using large language models automates the data extraction process, significantly increasing its accuracy and speed. The Amazon Neptune database, based on a graph model, offers flexibility in data representation and relationships, as well as ease of scaling with increased data volumes. Integration with the OpenAI model allows for complex natural language queries, simplifying data access for end users. This is particularly useful for researchers and historians who do not need to learn specialized query languages. Graph databases provide high performance for complex queries, making them ideal for analytical tasks and uncovering hidden relationships in the data.
However, challenges exist. The accuracy of extracted data heavily depends on the quality and structure of the source texts. Poorly structured or low-quality texts can lead to errors in data extraction. Processing large data volumes may require optimizing the ETL pipeline's performance and database queries. Security aspects are also crucial when working with historical data, especially if it includes personal or confidential information.
Conclusion
The development of the ETL pipeline and its integration with the "Historical Ontology" opens new possibilities for analyzing and interpreting historical data. Our solution not only automates the extraction and structuring of information but also provides convenient tools for working with data through text queries. This makes historical research more accessible and efficient, contributing to new discoveries and a better understanding of the past.
In the future, we plan to expand our ontology to other regions and historical periods and improve our LLM-based solutions to enhance data extraction accuracy. We are confident that these technologies will find broad applications in digital humanities and other related fields.
15 July
May 2024 - Roman Chepenko - Using Large Language Models for Feature Engineering and Annotating Historical Data.
Introduction
The development of large language models (LLMs) offers significant opportunities for automating the analysis of vast datasets for various purposes. At Historica, our research laboratory, we have delved into the field of feature engineering using LLMs to explore their potential in historical data annotation.
Modern AI technologies are opening new horizons for analyzing historical data. In paper "The Semantics of History" by the University of Barcelona, the authors formulated the approach of annotating and storing data for analyzing textual data from different fields of study. The primary goal of our experiment is to test the hypothesis that LLMs can be effectively utilized for feature engineering of historical data based on suggested approach.
Review of the University of Barcelona's Study
- Unit of Topography (UT): Evidence of an action or situation located in space and time, regardless of the specificity of the information source and its attributes. Each UT has a specific location and date, which can be expressed as a UTM coordinate or an administrative delimitation that might have changed over time.
- Unit of Stratigraphy (US): Material evidence of a past action, representing an archaeological aspect of the cycle of time. Essential attributes of these units include graphic and cartographic representations.
- Actor: An individual or corporate entity involved in an action identified as a UT, with attributes like name, gender, religion, citizenship, date of birth and death, etc. Multiple individuals gathered for a specific period with a particular purpose can act as corporate actors
Automatic Annotation of Historical Data
Automatic annotation is a crucial step in the analysis of any textual data, especially for historical data, where the accuracy of annotations is critical. Traditional methods include manual annotation, which is time-consuming and labor-intensive. Besides manual labor, alternative approaches for annotating historical textual data include spaCy, NLTK, TextBlob, and StanfordNLP. With advancements in the field of ML/NLP transformers, modern technologies like LLMs enable automation of this process, significantly speeding up and simplifying the work with large datasets.
Capabilities of LLMs for Automatic Annotation
LLMs offer powerful tools for processing and analyzing textual data. They can generate annotations, classify texts, and identify hidden connections in the data. LLMs are also suitable for feature engineering. One of the critical questions at this stage is choosing between open-source models and proprietary models (APIs from OpenAI, Google, etc.).
When selecting tools for data analysis, it is essential to consider various aspects such as accessibility, cost, and flexibility. Open-source solutions provide a high level of flexibility and customization for specific tasks. Proprietary solutions, on the other hand, may offer more stable and ready-to-use tools but are often limited in customization and require significant resources.
Experiment with LLMs
For our experiment, we aimed to compare several models from OpenAI and selected a few open-source models for a comprehensive evaluation. The criteria for selection included text generation quality, speed, and customization capability. We relied on the LLM Arena on Hugging Face to guide our choice of models.
Data Collection for the Experiment
Data for the experiment were gathered from open historical sources. We randomly selected texts related to Estonia stored on Wikipedia. The data were standardized, resulting in five texts of varying lengths. Three texts had token counts (the smallest meaningful unit for LLMs) not exceeding 400, while the remaining two texts consisted of 2955 and 12488 tokens.
Overview of the Experiment
The experiment involved annotating historical texts using the selected models. The primary task was to verify the hypothesis derived from the University of Barcelona's article. An example task included analyzing historical text using the following prompt:
“As a specialized NLP model, your task is to process historical text data for ontology-based storage. Your task is to analyze the historical text below and extract important information relevant to the ontology database. Specifically, identify entities and relationships based on the following categories:
- UT (Unit of Topography): The evidence of an action or situation that can be located in space and time. It should include both a location and a date.
- US (Unit of Stratigraphy): The material evidence of a past action, typically archaeological in nature. Graphic and cartographic representations are key attributes.
- AC (Actor): Individuals or organizations involved in an action linked to a UT. Attributes include name, gender, citizenship, and other personal details.
Provide the extracted data in JSON format with the following structure:
{
"UT": [
{
"location": "<location>",
"date": "<date>",
"attributes": ["<additional attributes>"]
},
...
],
"US": [
{
"evidence": "<description>",
"attributes": ["<additional attributes>"]
},
...
],
"AC": [
{
"name": "<name>",
"attributes": ["<additional attributes>"]
},
...
]
}
Text: {text}
Comparative Analysis of Models
We have embarked on an exploration of feature engineering using LLMs, particularly focusing on the automatic annotation of historical data. This report provides a comprehensive evaluation of several LLMs, assessing their performance based on multiple criteria:
- Аccuracy and completeness,
- Сonsistency and relevance,
- Latency and cost-effectiveness,
- Absence of hallucinations
- Subjective evaluation of model output.
Our goal is to determine the most effective models for historical data annotation and to provide insights into their practical applications.
Model Performance Summary
GPT-3.5-turbo-instruct
GPT-3.5-turbo-instruct demonstrated high efficiency and consistent results across all analysis categories. With high accuracy, consistency, completeness, and relevance, the model only failed to meet the requirements once, indicating its reliability and capability to produce high-quality annotations. Its moderate latency and high cost-effectiveness further highlight its suitability for extensive historical data annotation tasks. The model also exhibited excellent performance in avoiding hallucinations, ensuring the integrity of the generated annotations.
Llama-codellama-7b-instruct
This variant proved to be the weakest in our set, consistently showing below-average results compared to other models. With low accuracy, consistency, completeness, and relevance, it struggled to meet the necessary standards. Despite its high latency and moderate cost-effectiveness, its persistent low performance makes it less suitable for automatic historical data annotation tasks. Additionally, the model often produced hallucinations, further reducing its reliability.
Llama-3-8b-instruct
The model exhibited variable performance depending on the task, demonstrating moderate accuracy, consistency, completeness, and relevance. In some cases, it significantly outperformed other models, showing potential for specific types of tasks. However, its moderate latency and high cost-effectiveness are offset by its inconsistent performance, making it less reliable for general application. The model performed moderately in avoiding hallucinations, indicating some potential for improvement.
Mistral-7b-instruct
While this model occasionally delivered good results, it was unstable and did not always meet evaluation criteria. It showed moderate accuracy, completeness, and relevance but low consistency. Its high latency and moderate cost-effectiveness reduce its overall effectiveness for automatic annotation, particularly where consistency is critical. The model's moderate performance in avoiding hallucinations indicates a need for further refinement.
Mixtral-8x7B-Instruct-v0.1
This model operates relatively quickly and maintains the data structure in its outputs, demonstrating moderate accuracy, consistency, and relevance. However, its responses are sometimes superficial, resulting in low completeness. The model's high latency and low cost-effectiveness further impact its overall performance, making it less suitable for comprehensive historical data annotation. Its moderate ability to avoid hallucinations is insufficient to compensate for its other weaknesses.
Mixtral-8x7b-instruct-gptq
The model demonstrates good adherence to annotation structure and effective memory utilization for attribute filling, showing high accuracy, consistency, and relevance. However, its responses are not always comprehensive, which limits its completeness. With moderate latency and high cost-effectiveness, this model excels in maintaining high accuracy and consistency while effectively avoiding hallucinations.
Phi-3-medium-128k-instruct
This model consistently delivers good results, with high accuracy, consistency, completeness, and relevance. Although it is not the fastest, its low latency and large context window allow it to handle complex tasks effectively. Its moderate cost-effectiveness is balanced by its ability to maintain high performance in avoiding hallucinations, making it a good option for similar research.
Groq-llama3-70b
The model provides good and fast responses, showing high accuracy, consistency, completeness, and relevance. Its low latency and high cost-effectiveness make it one of the better options for similar tasks. Additionally, its high performance in avoiding hallucinations ensures the reliability of its outputs.
GPT-4o
This model offers very fast and high-quality responses, with a large context window, demonstrating high accuracy, consistency, completeness, and relevance. Its very low latency and high performance in avoiding hallucinations make it an excellent choice for tasks involving automatic annotation of historical data, especially where speed and accuracy are paramount. While its cost-effectiveness is moderate, the overall benefits significantly outweigh this factor.
Summary
In summary, the analysis highlights GPT-4o and GPT-3.5-turbo-instruct as the most effective models for historical data annotation, offering an optimal balance of speed, accuracy, and reliability. Llama-3 and Phi-3 also demonstrate strong performance and are reliable choices. The remaining models, although showing potential in specific areas, require further refinement to meet the high standards necessary for comprehensive and dependable historical data annotation.
Our experiment also revealed several pitfalls in comparing models, one of the most significant being the limitations of context windows. Only two models were able to fully process the text containing 12,488 tokens. For the other models, it was necessary to segment the text into smaller parts to fit within their context window limits.
This issue raises a critical debate: Is it more effective to generate multiple responses from a model for different parts of a single text and then integrate these responses into a cohesive final answer (a process that demands additional computational and integration resources)? Or is it preferable to obtain a single, comprehensive response from a model capable of analyzing the entire text in one go, despite the risk of potentially omitting some information?
This trade-off between resource allocation and the risk of data loss requires further investigation to identify the optimal strategy for large-scale historical data annotation tasks. Such exploration will be crucial in determining whether the consolidation of multiple outputs or the use of models with larger context windows better serves the goals of accuracy and efficiency in historical data processing.
.png)
.png)
Conclusions
The use of LLMs for historical data annotation is a promising direction, capable of significantly accelerating and improving the quality of analysis. Our research has confirmed the hypothesis that LLMs can be effectively utilized for feature engineering of historical data, based on the annotation data format formulated in the results of the University of Barcelona's article. Modern models provide researchers with powerful tools for automating the annotation and processing of textual data, ensuring high accuracy, consistency, and completeness of results. The choice of a specific model depends on priorities such as accuracy, speed, cost-effectiveness, and reliability.
The integration of advanced AI technologies into historical analysis opens new pathways for interdisciplinary research, fostering more accurate and efficient methods of data processing and interpretation.
In the future, our laboratory plans to experiment with the use of LLM agents for the automatic population of historical ontology, further expanding the capabilities and applications of these advanced models in the field of digital humanities.
For further inquiries or detailed information on our findings, please feel free to contact us.
References
April 2023 - Anadea - How we use the Perceptual similarity metric (LPIPS).
In the ongoing series of experiments surrounding the generation of historical maps, this article introduces a crucial tool for evaluating the fidelity of generated images: the Perceptual Similarity Metric, or LPIPS. Rather than relying on mere pixel-by-pixel comparisons, LPIPS leverages the power of neural networks to provide a more nuanced understanding of image similarity.
This document describes how similarity between generated and original images can be evaluated with a perceptual similarity metric (LPIPS), and how we can use it to compare “quality” of generated images during training.
Reminder about data

Metric description
LPIPS is a metric that compares similarity between two images.
Instead of comparing two images by pixels, it uses features that can be extracted from a pre-trained neural network - meaning, we feed a network an image, and get some information from hidden layers of the network as an output.
Perceptual image similarity metric has two properties:
- It is large when human observes large difference between images
- It is small when observers consider images similar
We used this library to compare LPIPS between our images. To evaluate generation results we resized generated and original images to 1080x1080 (original images were cropped, generated images were downscaled to 3072x3072). Additionally, we compared LPIPS values for the same images downsized to 512x512.
How LPIPS can be used?
- Validation metric during training (to check if generation improved?)
- Comparing different models with one another
- Selecting best frame from multiple generated samples
- Selecting best model version after training
- Having multiple maps of the same style but in different periods, LPIPS can answer which map is “the closest in time” to some 3rd map - due to a general rule that the more years between the two maps - the more border changes there are on a map. This way, LPIPS can be used to cluster maps by period.
- Identify specific years or periods where generated images are of lower quality - and work on parts of the dataset related to it.
Let’s say we have an original image of a map of Europe in the year 1400.
We want to compare it with a generated image

LPIPS(original_1400, generated_1400) = 0.13760228
LPIPS(original_1400, generated_1400) = 0.13760228

LPIPS(original_1400, generated_1600) = 0.4240757
LPIPS(original_1400, generated_1600) = 0.4240757

LPIPS(original_1400, generated_1500) = 0.3257943
Comparing LPIPS for similar images
LPIPS differences are smaller if generated images are very similar.
For instance, let’s compare original image for a year 1400 and three generated images for this year
.webp)
Image with higher LPIPS in the center has different colors for two countries in the middle of a map (Lithuania and Moldova). While comparing all three images, we can see that only some parts of the map are visually different. After taking a closer look, you may notice that only Ottoman and Polish-Lithuanian borders are different, and on other parts of the map only few artifacts are different.
Relation of age differences between maps

*note that years 950 & 1800 were not present in a training data, generated images are purely fictional
It may be observed that the bigger the age gap between maps, the bigger LPIPS becomes
A note on resolution
We compared LPIPS on resolution 512x512

Comparing results between two tables (1080 x 1080 vs 512x512 resolution), it may be seen that when LPIPS@1080 is larger (i.e., 0.45), LPIPS@512 becomes roughly the same or slightly smaller (roughly -3% difference).
However, smaller LPIPS@1080 values (i.e., 0.15) leads to a bigger difference with LPIPS@512 (~25% difference). This implies that we should upscale our images to detect smaller differences on the map.
Conclusions
LPIPS widely extends our capabilities to understand generated maps quality.
It can be used in validation, selecting the best generated image and evaluation of model predictive power in general.
Moreover, LPIPS approach can be extended, and be potentially used to compare original and generated maps and show regions where model makes mistakes.
February, 2023 - Anadea- Experiments on Generating Historical Maps Using the StableDiffusion Model on Real Data.
In the evolving realm of digital cartography, the role of advanced models in generating detailed and accurate historical maps has become paramount. This article delves into the recent experiments conducted with the StableDiffusion model, focusing on its application to real-world maps. We explore the challenges and nuances of training this model using a diverse dataset comprising maps and historical texts.
Training StableDiffusion model on real maps
Second part of our work was dedicated to building a foundation model for various maps and texts. Our plan was to fine-tune Stable Diffusion on a large dataset of pairs of maps and historical texts relevant to them.
As for the data, we decided to proceed with WiT dataset, as it already includes both texts and maps of high quality - and is a great tool for building a foundation model. WiT consists of images and related text fields - we used a combination of page title, abstract and image caption as a text illustrating a map together with a map itself. To train our model only with relevant information we built two supplementary models, one for filtering images, and another one for texts. We worked with an `en`-only subset of WiT (5.4 mln entries).
We trained Stable Diffusion 2.1 on this data to see what it would generate from free-form historical textual description. Despite the fact that training took only 100k steps (single GPU, 5 days of training), it achieved significant results in generating maps from historical data.
- Ability of the model to generate maps from prompt
- Map quality - lack of artifacts, map details, etc.
- Ability to understand time period and region described in prompts
Ability to understand time period and region described in prompts


As you can see, the model trained on our data is able to identify historical region where events take place and draw its map. The prompt used for inference was not in the training dataset (and is of a different format).Maps are very diverse.
Let’s take a look at some more examples:


Despite the fact that the maps in this variation do not suffice goals of the project, one may argue that increasing dataset scale, applying better filters and using more tricks during preprocessing step combined with much longer pre-train will give accurate results of desired quality. Note that this version of the model was trained with less than 0.001% compute used during the training process of a proper StableDiffusion.
Additionally, we’d like to demonstrate how the quality of generated maps improves with longer training. Results after 40000 training steps are to the left, results after 100000 training steps are to the right


Conclusions
During our research we demonstrated that diffusion models can be used to generate maps.
We showed that, depending on the prompt, diffusion models are capable of generating parts of the map (region, province or even smaller scale), accurately re-draw borders according to a historical period, and editing already-existing maps based on new context.
We’ve shown that using generalized map dataset we can create a maps-only version of diffusion network, and with power of unsupervised pre-training at scale it will be able to achieve high generalization capabilities.
We’ve shown that using generalized map dataset we can create a maps-only version of diffusion network, and with power of unsupervised pre-training at scale it will be able to achieve high generalization capabilities.
Additional steps that may be taken into consideration
- Train a model for longer and on a larger dataset
- Explore different text2image networks
- Tune the model on “downstream tasks” - i.e., editing maps based on prompt, generating map given year and region, etc.
- Improve understanding of textual part of the network by training on text only
Next steps with regard to overall project development
To verify the hypothesis in full and make generated maps usable on physical maps, the following tasks need to be addressed:
- Learn how to translate generated maps into external format (i.e., OpenStreetMap). It would be necessary to “read” generated maps. In our vision, this problem has to be split into two parts: identification of countries and borders and matching them with textual information (i.e., country names). It is possible to integrate identification of countries and borders into a diffusion network.
- Maps should be generated in different styles. For that, one may assign various labels to maps in the dataset, based on content (i.e., political map, religious map) and style (lithography map, globe). Once labeled, labels would be inserted in prompt and be later used for generation.
- Finally, we could add some input-output layers to the model, and get different outputs from it (i.e., provide each map with coordinates of its boundaries, map type and any other information)
December 2022 - Anadea -A “Toy” Dataset for the Initial Learning.
This article covers the first stage of our research into generating historical maps using neural networks. Our initial work focuses on a simple "toy" dataset for preliminary learning. Here, we examine how the StableDiffusion model responds to textual prompts and what results can be expected at this early stage.
Project Goals and our ideas
Map generation project was focused on the idea that accurate historical maps can be generated using neural networks based on textual information
Our research aimed to test a hypothesis that historical maps of high quality can be generated with diffusion models from prompts with textual description of requested region and historical period. Our task was to check that specifically StableDiffusion can be used, and to understand its possibilities and limitations with regard to how it understands prompts.
We decided to start with the following ideas in mind:
- Use StableDiffusion as our base network
- Explore how to generate maps from different prompts - starting from easiest to hardest.
- Conduct experiments with one prompt at a time.
- Each experiment has its own training data.
- During the experiment network is additionally trained to generate maps from textual prompts like in training data.
- After the first phase of experiments is done, collect a large corpora of historical texts and maps – and train StableDiffusion on various maps and real historical texts.
Used data
To speed up our research, we used a “toy” dataset of historical maps for experiment purposes. It was based on this video and consisted of yearly maps of Europe in a single style. This dataset was not historically accurate, yet it let us understand the challenges of real-world data.
Time period of maps that we used for experiments was limited to 1000 A.D. - 1800 A.D.
Each image in a dataset had a corresponding prompt where region, year and list of countries could have been mentioned.
We used StableDiffusion (mostly, v.2.1) and trained the U-Net part of the model using <image, prompt> pairs, and then evaluated using prompts in and out of the given time period. A typical dataset for such an experiment consisted of 700 to 8000 image-text pairs, which was enough for experimenting purposes.
Experiments and results
We’ve done five major experiments, each time feeding the model with more complex prompts:
1. Generate a map given prompt with a year and an image of a map.

The goal was to check the possibility of generating maps that would change based on a year in a prompt and see how SD catches map style.
We got good results:
- Generated maps borders are highly accurate
- There were almost no artifacts, generation quality is good
- We even got readable country names, which was not expected
Generated examples: (click to open larger images)
.webp)
These results can conclude that the model can change countries and their borders using a given year.
2. Generate a map given prompt with a year and list of countries on a part of a map.

The goal was to check if the model can understand connections between country and region, and generate smaller maps where countries from the prompt would be displayed.
Results for this experiment were great, the model was drawing accurate crops of different regions. By scaling the dataset with different crops we could potentially train a model to generate very small parts of the map or manipulate the scale of the map through the prompt.

3. Generate a map given prompt with a year and a message like “country A conquered country B”.

In our next experiment we wanted to check if parts of the generated map can be manipulated through the prompt. Experiment results were mixed - final “accuracy” of the model is ~40% (based on the number of correct re-drawings of country B into colors of country A).
Although the results were poor, the experiment was still useful:
- We discovered LoRA - a method to quickly learn new “concepts”, such as borders of specific countries - and to learn it in literally seconds.
- We learned that not all the prompts fit diffusion models - partially because most prompts in datasets used for pretraining only describe an image - and do not give any instructions on how to change it. We concluded that manipulating a generated map is a different task.
- We found a special version of SD trained specifically to edit images -Instruct Pix2Pix. Training InstructPix2Pix to edit maps became our next experiment.

4. Edit a map given prompt with a year and a message like “country A conquered country B”.

In this experiment we wanted to check if map can be edited with a prompt that describes certain changes (i.e., year is the same, but a certain country conquered another country). We trained InstructPix2Pix to edit the original map with a certain edit instruction.
Results were accurate - model did exactly what was asked by a prompt:

5. Edit and generate maps based on historical texts of arbitrary length
A fundamental limitation of the StableDiffusion model is that the max length of its text encoder (CLIP) is limited to 77 tokens. To overcome this limitation we implemented a trick of splitting input text into chunks of 77 tokens, encoding each chunk into its own embedding, and feeding the model with average embedding. To verify that average embeddings do not negatively affect model generation capabilities we trained both vanilla SD that generates maps from long inputs and InstructPix2Pix model for editing maps based on longer texts.
For longer prompts, we decided to query DBPedia for information on historical events:
- For XVth century, we got descriptions of 286 events, 213 of them were longer than 77 tokens
- For InstructPix2Pix model we used the scheme from previous experiment - having a map and event for a year X, we can:
- Use map for a year X as edited image
- Use event description as prompt
- Use map for a year X-N (N close to 10) as an original map
- Generate samples with different N re-writing the prompts using LLM
- ~2200 pairs - enough for basic training
Results:

Results demonstrated that the model understands long prompts, uses texts from various parts of the prompt and can work with very long texts.
Experiments conclusions
Aforementioned experiments were a necessary foundation to understand model behavior while training on real maps and texts.
During experiments, we discovered a few important things that allow us to speed up future development. Here are just a few of them:Found an effective way to increase generated image size and quality up to 16x using SuperResolution. This allows us to potentially generate images up to size 12288x12288. (Generated examples in the doc are 3072x3072 and are already of decent quality).
- Started using LPIPS as an evaluation metric - it allows us to measure how similar the generated image is to the original .
- Sped up training process by at least 3 times (using memory-efficient optimizers, experimental implementation of certain network layers and utilizing more aggressive training strategies that allow us reduce number of training steps 10 times)
- Experimented with training models on different checkpoints at different resolutions, and concluded that the highest quality of images can be achieved with SD-2.1 at 768x768, with SD2.1 being the best checkpoint available so far overall (SD-1.5 may be better at generating texts, but is generally worse and unable to work with 768x768 without proper fine-tuning on high-res images). Most of our experiments were on images of 512x512 due to time and resource constraints.